 MapConductor
Docs / Extensions / Heatmap
Heatmaps
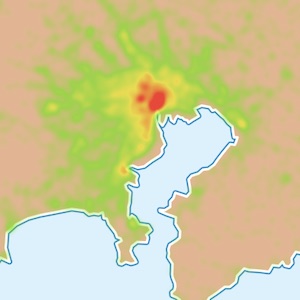
Density data rendered as a tile-based raster layer. It is provider-independent, so swapping the map does not change how it looks.
ANDROID
com.mapconductor:heatmap
iOS
MapConductorHeatmap
REACT
@mapconductor/react-heatmap
01 · Install
app/build.gradle.kts
implementation("com.mapconductor:heatmap")Package.swift
.package(url: "https://github.com/MapConductor/ios-heatmap", from: "1.1.4"),
.product(name: "MapConductorHeatmap", package: "ios-heatmap"),
terminal
npm install @mapconductor/react-heatmap
02 · Usage
Declare points inside the overlay. For large datasets use the batch component to send them in one update.
HeatmapScreen.kt · Jetpack Compose
val pointStates: List<HeatmapPointState> = remember { buildPointList() }

MapLibreMapView(state = mapState) {
    HeatmapOverlay(radiusPx = 20, opacity = 0.7) {
        HeatmapPoints(pointStates)
    }
}
HeatmapView.swift · SwiftUI
let pointStates: [HeatmapPointState] = buildPointList()

MapLibreMapView(state: mapState) {
    HeatmapOverlay(state: HeatmapOverlayState(tileSize: 512, radiusPx: 20, opacity: 0.7)) {
        HeatmapPoints(pointStates)
    }
}
HeatmapPage.tsx · React
import { HeatmapOverlay, HeatmapPoints, HeatmapPointState } from '@mapconductor/react-heatmap';

const points = useMemo(
  () => DATA.map(([latitude, longitude], i) =>
    new HeatmapPointState({ id: `p-${i}`, position: createGeoPoint({ latitude, longitude }) })),
  [],
);

<MapLibreMapView2D state={state}>
  <HeatmapOverlay>
    <HeatmapPoints states={points} />
  </HeatmapOverlay>
</MapLibreMapView2D>
03 · Options
Option
Default
Description
radiusPx
20
Blur radius of each point, in pixels.
opacity
0.7
Opacity of the whole overlay.
gradient
DEFAULT
Colour ramp across intensity; stops are fully configurable.
tileSize
512
Edge length of the generated tiles, in pixels.
weightProvider
state.weight
How each point's weight is read; by default it uses each HeatmapPointState's weight (default 1.0) — for population, revenue and similar quantities.
04 · Performance
Drawn as tiles
The heatmap is generated as raster tiles, so the number of overlays stays constant as points grow. The sample renders 24,526 points.